

© Data Connexions Liimited 2012 - All Rights Reserved
Stoneways
Gorse Meadow
Bourton on the Water
Gloucestershire
GL54 2DY
Data Connexions Limited
Transforming your data into information

+ (44) 01451 822 909

Geospatial Analysis
Data Connexions puts your customers and prospects on the map.
By geocoding your data we can convert it into a map that can be panned and zoomed. Once processed we can add extra layers based on data you supply such as revenue, number of customers etc. These extra layers can be shown using colours or symbols as required.

See to believe
Get yourself on the map
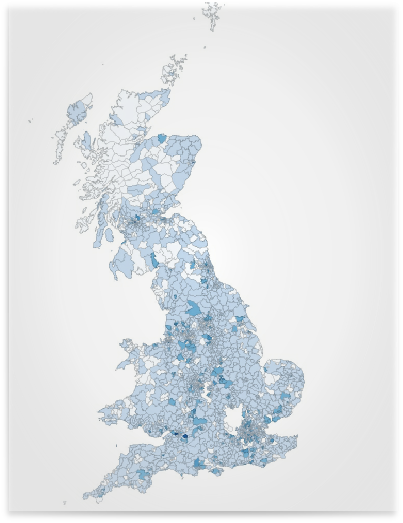
To the right is an example of analysis that shows the results using a visual representation,
this heat map shows a given data set, and represents a number of assets held within
postal code regions, in this example the darker the shading the more assets held.
This type of visual representation can be useful when presenting data, as it is easy to see the results of a large datasets at a glance to provide top level analysis. From this level it is possible to drill down much further for more localised and detailed data.
Many overlays can be added to a heat map, thus visualising various layers of data as required.
Uses
• Visualize your customers & prospects
• Define sales territories & coverage models
• Plan marketing campaigns
• Analyse distance to offices/shops/network infrastructure